The By-Product Analysis screen enables you to analyse the production of By-Products from either the Production By-Product (or Version) or Engineering Change Request within Business Central.
You are able to view all of the Production Orders that have had By-Products produced against them, giving visibility of the By-Products you are producing in relation to your manufacturing processes.
In all instances the Analysis screen can be accessed by navigating from the main menu of the relevant screen, such as the Production By-Product Card screen, as is shown below.

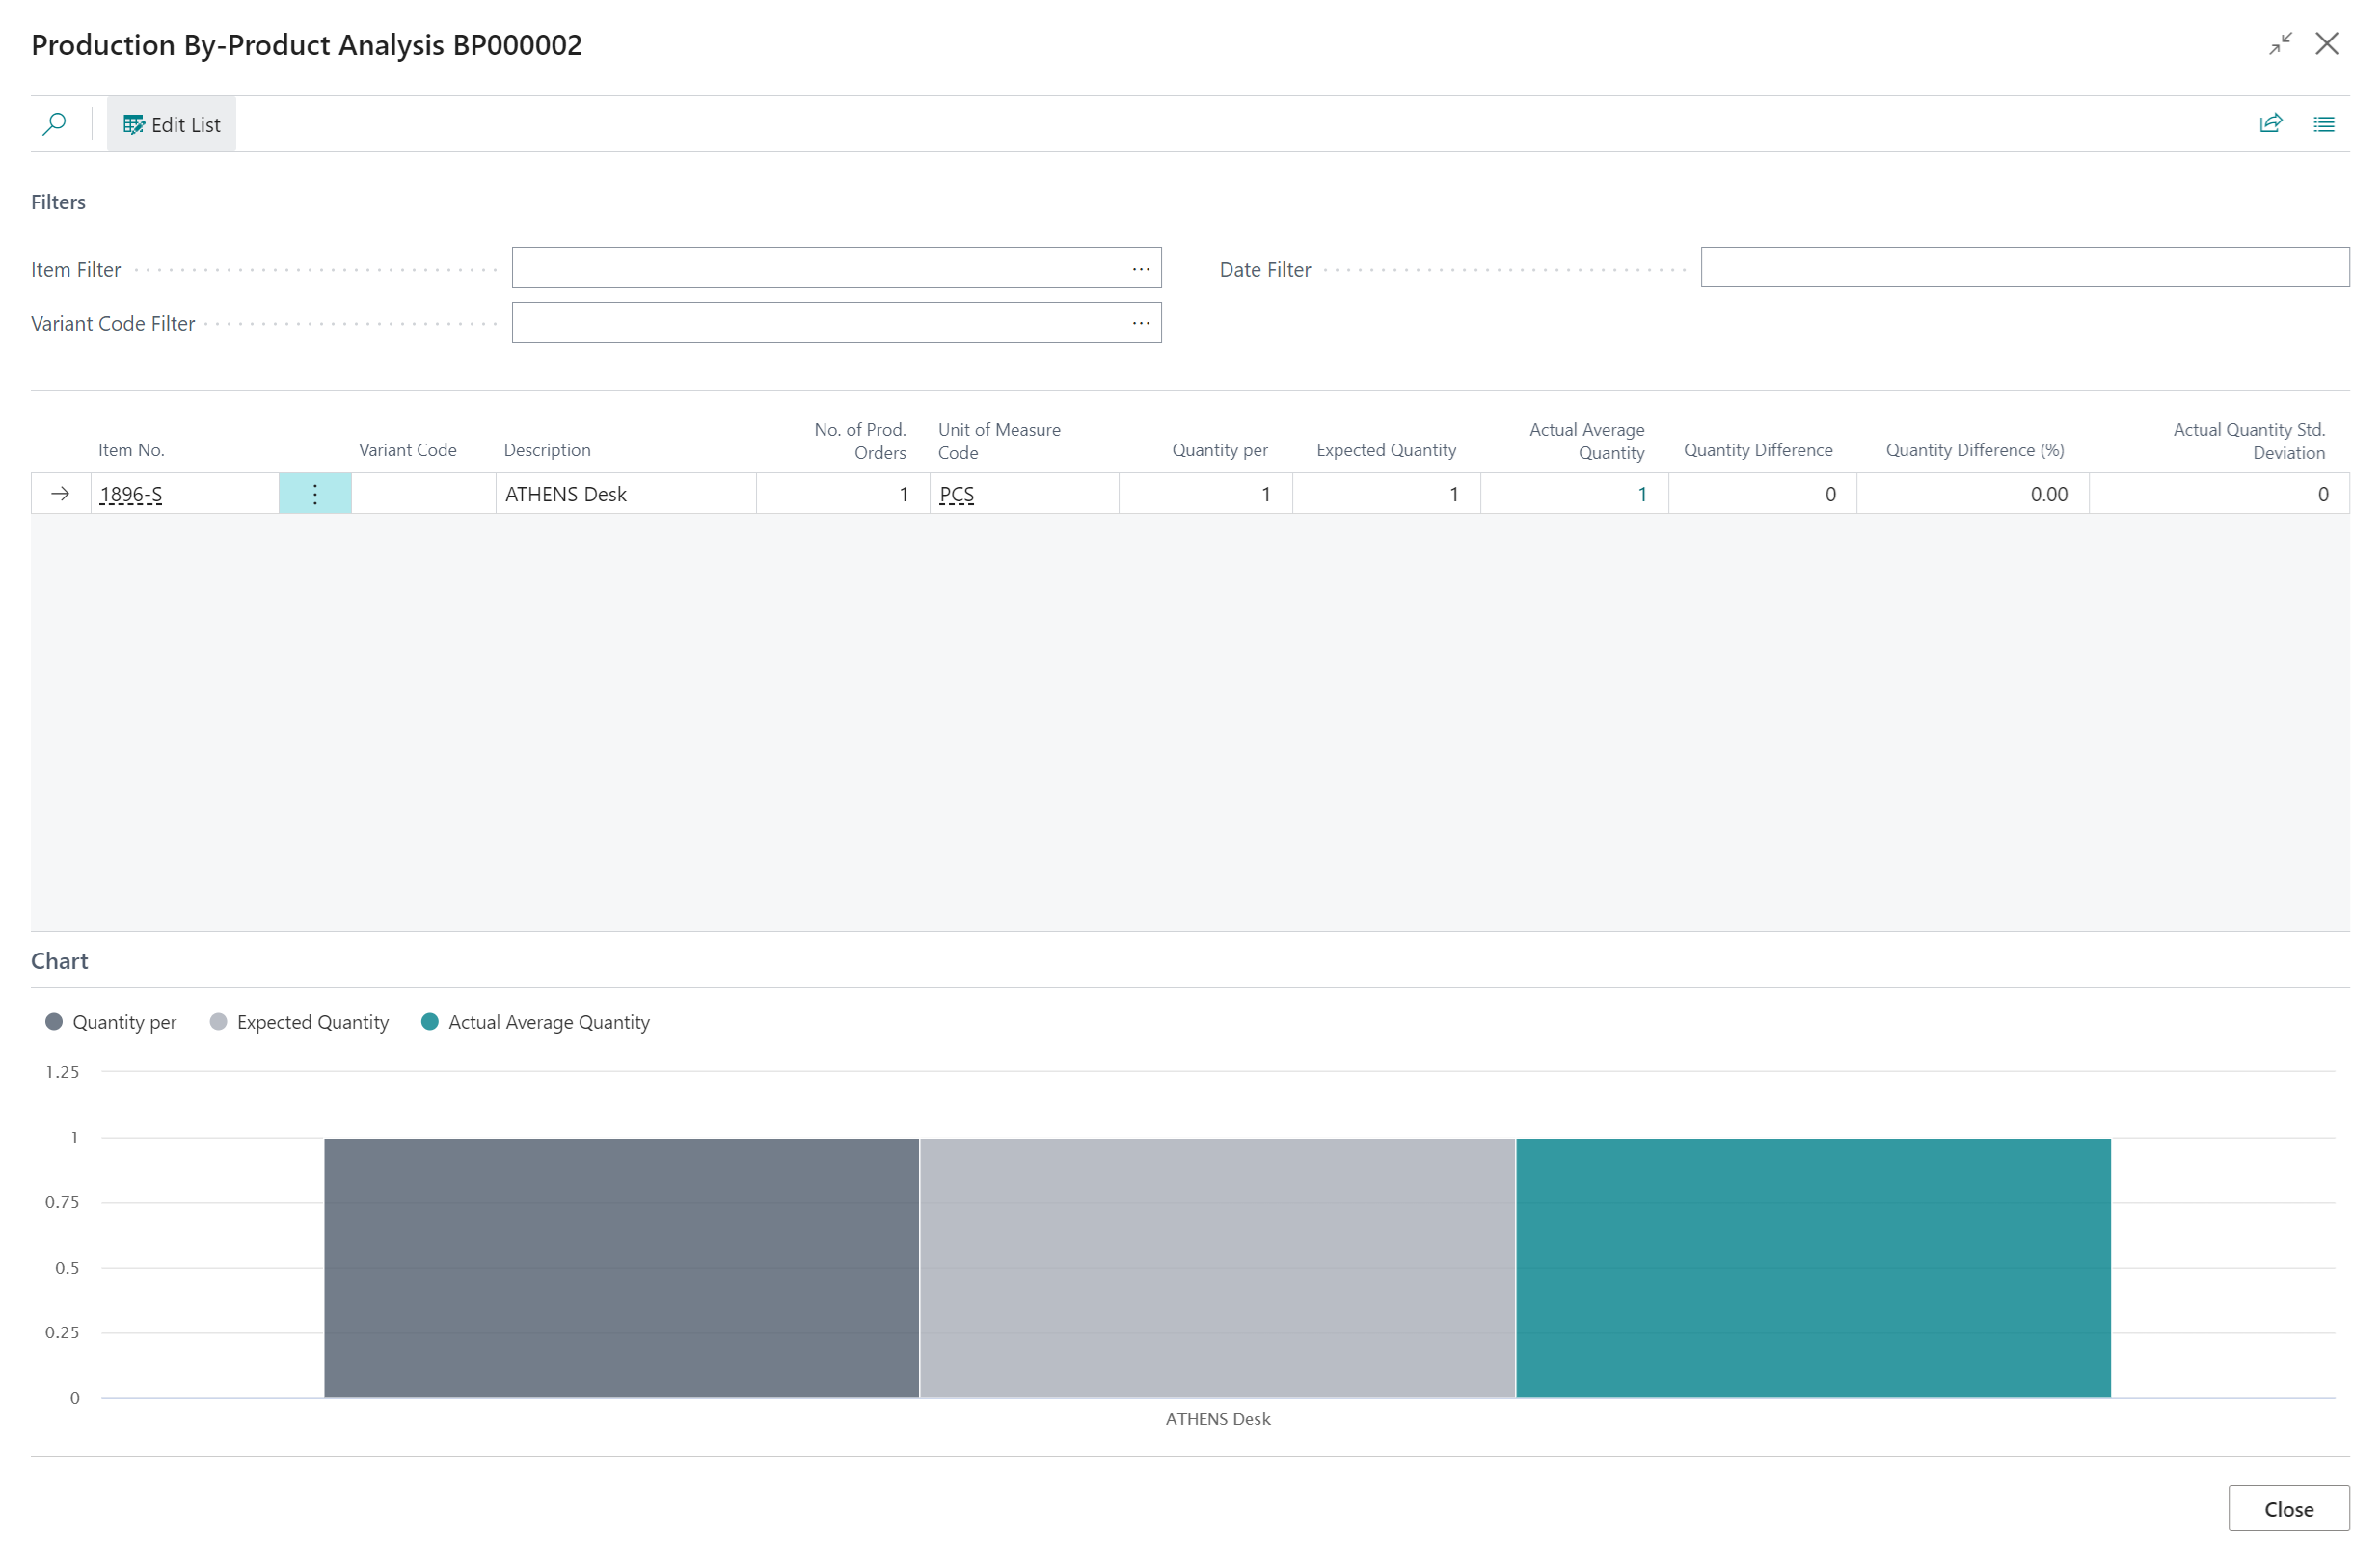
When the Analysis screen is open, there are three parts that make up the analysis functionality, which are the Filters, the Analysis section and then a Chart section to show a visualisation of Expected and Actual Output of By-Products.
The filters can be used to refine the analysis according to the following metrics.
| Item Filter | This can be used to define the Finished Item No., as it maybe the case that the same BOM is used across multiple Output Items |
| Variant Code Filter | A Variant Filter, so that you can (where required) view analysis information only for specified Variants |
| Date Filter | Use this to change the period within which you want to analyse. The date here relates to the date that the Consumption has been posted |
An example of the Analysis screen is shown below.

The analysis section shows the following information for each Production BOM Component.
| Item No. | Shows the By-Product Item No. |
| Variant Code | If relevant, the Variant Code will be shown |
| Description | The Description of the Item/Variant |
| No. of Prod. Orders | This is the total number of Production Orders that the By-Product Item has been Output against |
| Unit of Measure Code | The Unit of Measure for the By-Product |
| Quantity per | This is (if defined) the expected quantity that you expect to Output for the By-Product when producing each intended Output Item |
| Expected Quantity | The total Expected Quantity you expect to produce for the By-Product |
| Actual Average Quantity | This shows the Output that has been produced against the Production Orders |
| Quantity Difference | Will highlight any difference between the Expected Quantity and the Actual Average Quantity |
| Quantity Difference (%) | This shows the difference as a percentage |
| Actual Quantity Std. Deviation | This shows the standard deviation based on the actual Output of By-Products through the production process |