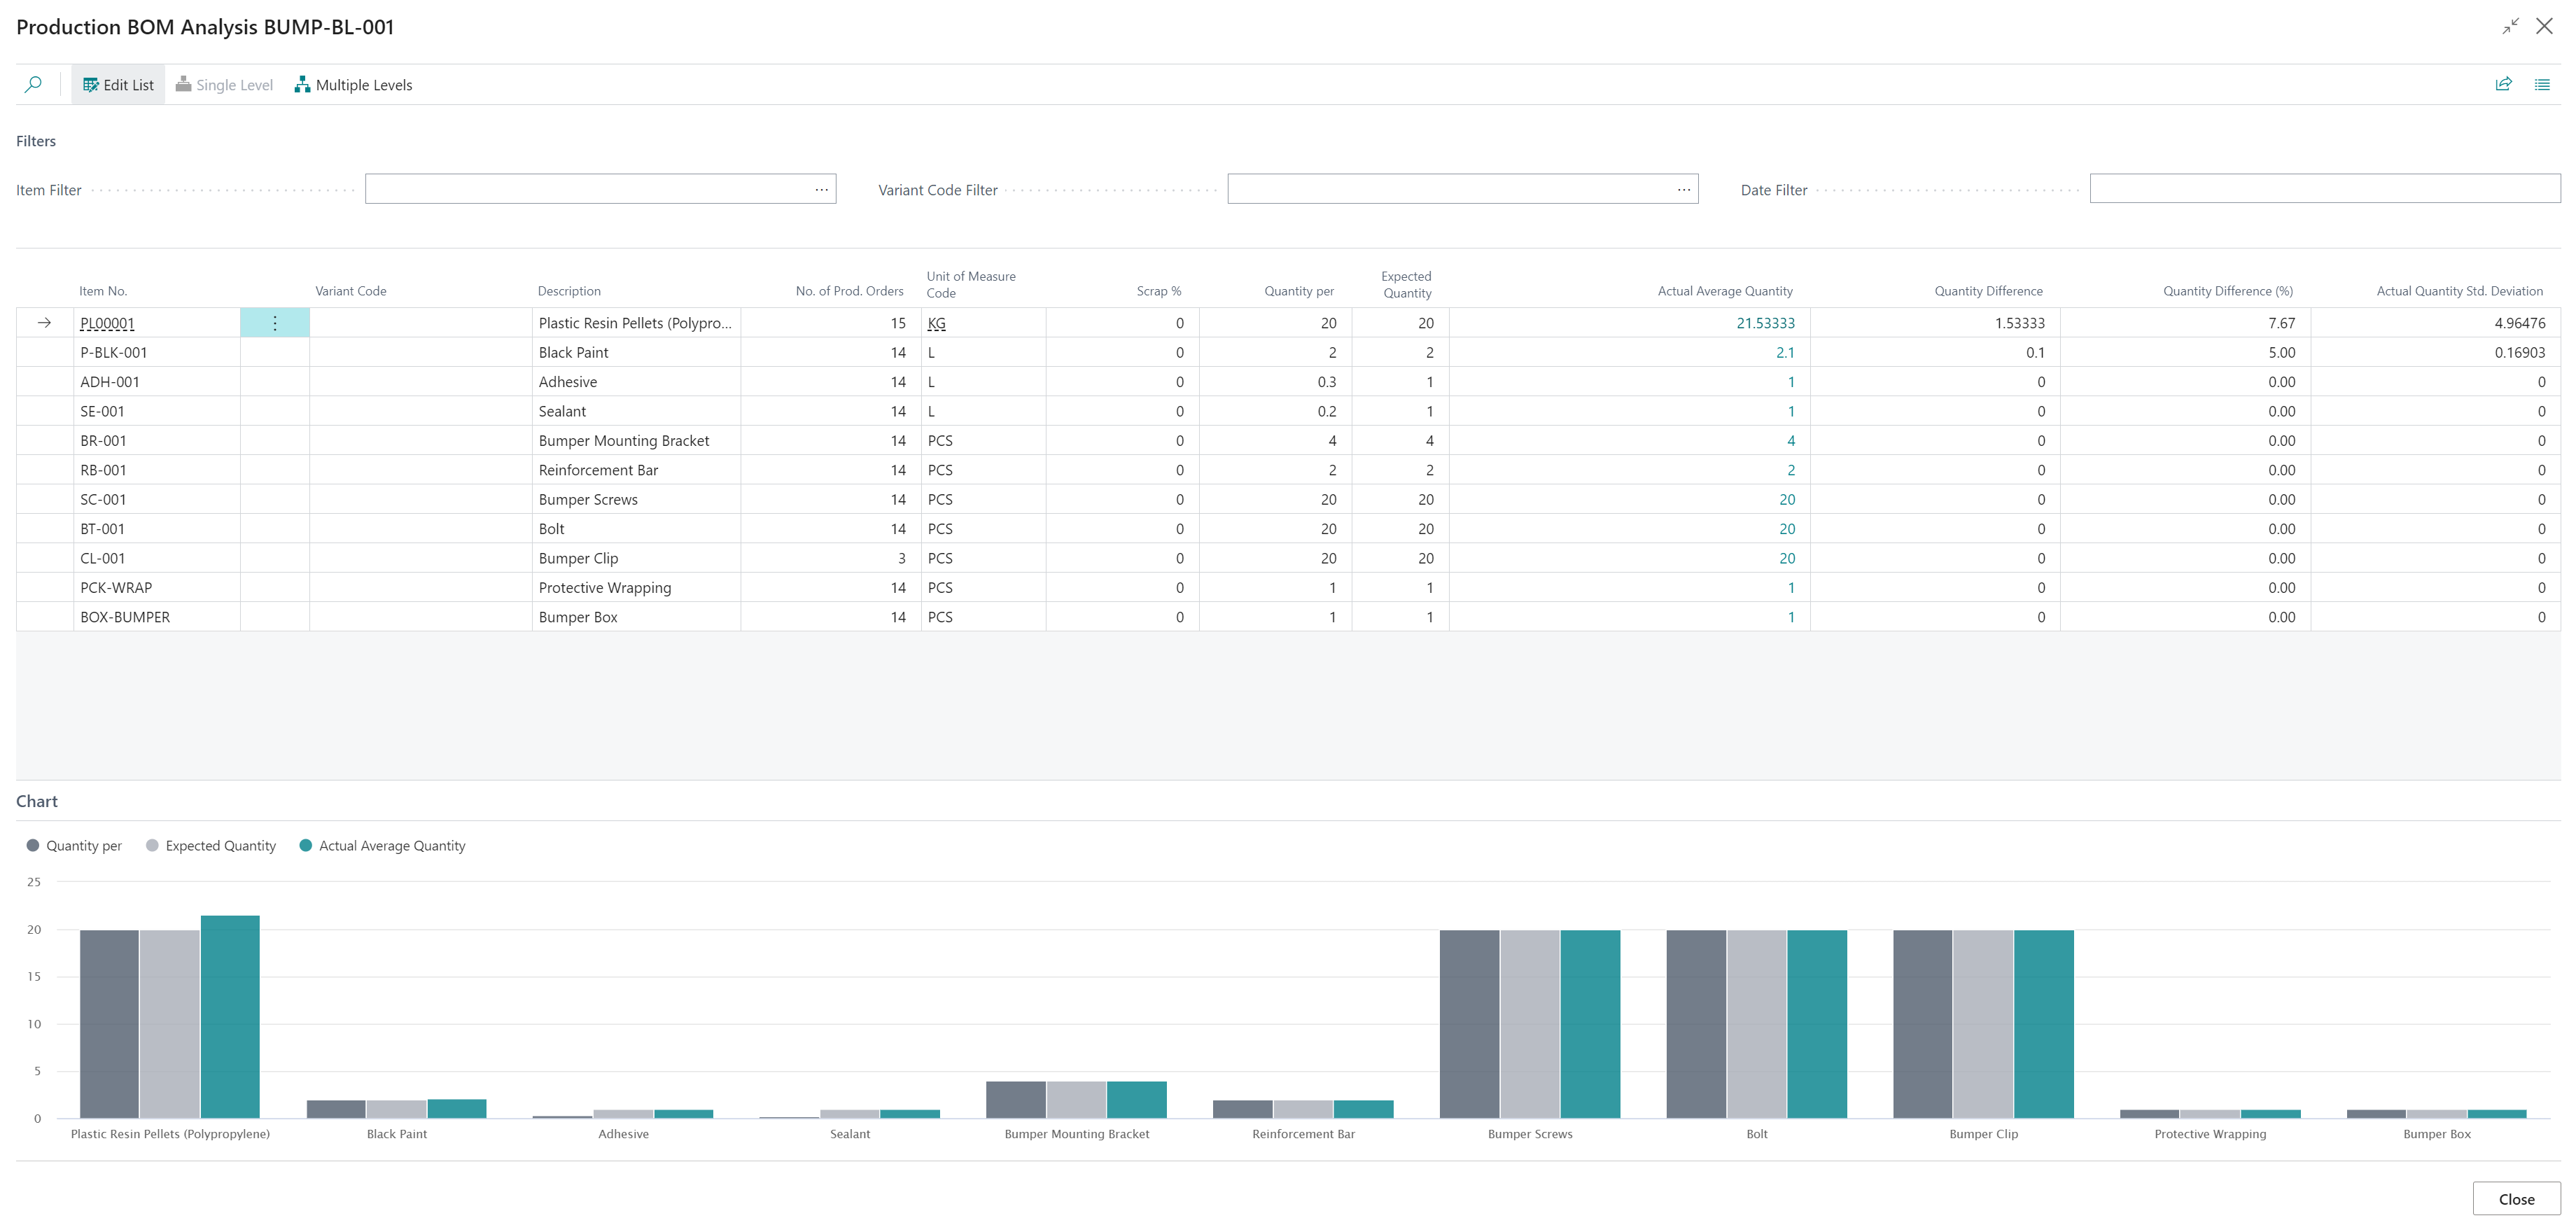
The Production BOM Analysis screen enables you to see a detailed analysis of the usage of the Bill of Materials (BOM) and is available from the Production BOM, Production BOM Version and also Engineering Change Request screens within Business Central.
Using the analysis screen you can view the number of production orders for which the BOM has been used and alongside this you can identify whether the expected usage of components is in line with what is happening on the shop floor. In addition to this, the analysis information contains Standard Deviation Calculations so that you can quickly identify whether there are inconsistencies in materials usage that need further investigation.
In all instances the screen can be accessed by navigating from the main menu of the relevant screen, as shown here using the Production BOM Card as an example.

When the Analysis screen is open, there are three parts that make up the analysis functionality, which are the Filters, the Analysis section and then a Chart section to show visual representations of the BOM Component Analysis.
The filters can be used to refine the analysis according to the following metrics.
| Item Filter | This can be used to define the Finished Item No., as it maybe the case that the same BOM is used across multiple Output Items |
| Variant Code Filter | A Variant Filter, so that you can (where required) view analysis information only for specified Variants |
| Date Filter | Use this to change the period within which you want to analyse. The date here relates to the date that the Consumption has been posted |
An example of the Analysis screen is shown below.
| Note: Where you have a multi-level BOM you can choose to show Single Level or Multiple Levels within the Analysis screen for full clarity of materials used. |

The analysis section shows the following information for each Production BOM Component.
| Item No. | The Item No. related to the Component |
| Variant Code | The Variant Code of the BOM Component |
| Description | The Description of the Item |
| No. of Prod. Orders | This is the total number of Production Orders that the component has been consumed against - when consumed against a Production Order that uses the selected Production BOM |
| Unit of Measure Code | The Unit of Measure for the component Item |
| Scrap % | Defines whether there is any expected Scrap % for the component when used as part of the Production BOM |
| Quantity per | The Quantity per as defined on the Production BOM |
| Expected Quantity | The total quantity expected to be used, which includes the Quantity per and the Scrap % allowance |
| Actual Average Quantity | This shows the actual average consumption quantity for the Item |
| Quantity Difference | Shows the difference between expected and actual consumption and can be used to highlight potential issues with material usage |
| Quantity Difference (%) | Shows the above difference as a percentage to identify the potential size of any usage variances |
| Actual Quantity Std. Deviation |
This shows the deviation of the actual consumption quantities used in production - therefore highlighting whether the usage is consistent (low %) or varied (%). A large Quantity Difference (%) in relation to a low Actual Quantity Std. Deviation may highlight that you should look to update the Quantity per on the "Production BOM". |