Quality Statistics can provide more details regarding the Posted Quality Orders such as what was tested and when.
Available from the "Customer Card", "Vendor Card", "Item Card" and "Stockkeeping Unit Card", the Quality Statistics can be found in the ribbon for these pages, via the Quality Action.
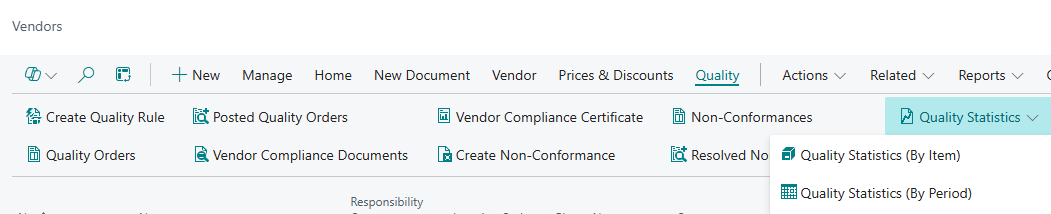
Dependant on where you access these reports depends on the view so see breakdown below:
Vendor & Customer Lists and Cards
| Quality Statistics (By Item) |
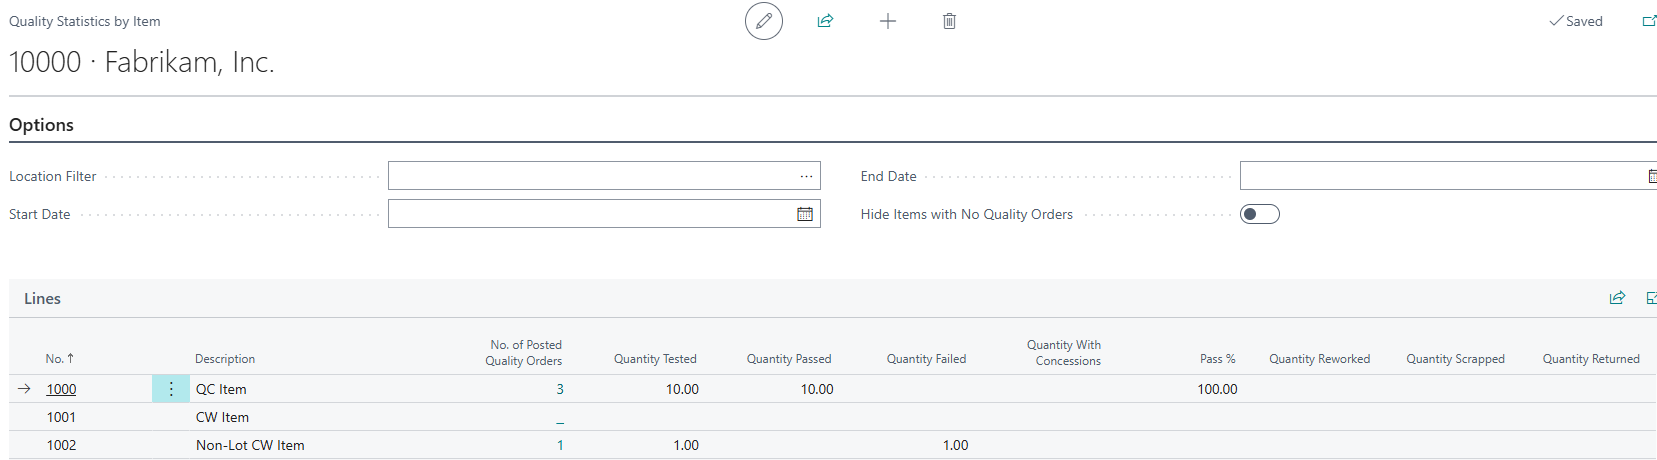
Highlighting a Vendor or Customer and then selecting this report will show a list of all the Items and the Posted Quality Orders associated with the item (for this specific customer/vendor). Great for identifying patterns of pass/failure rates by item and per Customer and Vendor. |
| Quality Statistics (By Period) | Highlighting a Vendor or Customer will open a report where you can view all Posted Quality Orders for them based on periods, i..e 'Month', 'Day', 'Week', etc. You can also apply Item and Location filters in here to reduce the list. |
Item List and Card
| Quality Statistics |
Exactly the same as the Quality Statistics (By Period) report above just not Customer/Vendor specific so this contains a list of all Posted Quality Orders for the Item in total. Location and Period filters can be applied as well as Pass/Failure rates. |
| Quality Check Statistics | Will show a list of all the Checks for the highlighted Item that have had Posted Quality Orders. This is ideal so you can see which Check Codes have had posted results as well as No of Passed/Failed. This can also be viewed by Period. |
Where "Periods" are specified, the options you can view the data by are 'Day', 'Week', 'Month', 'Quarter', 'Year' or 'Accounting Period'. This will change the data in the Lines FastTabs to show the relevant statistics based on the period selected.

You can also use the View As field to display whether you want the Lines data to show the 'Net Change' or the 'Balance at Date'. 'Net Change' will display any new data in the selected time period only whereas 'Balance at Date' would display the data up to the selected period including the previous data so it would display the Statistics as a snapshot in time taking into account previous periods.
The Lines FastTab will then display the relevant statistics based on the views you have chosen. Firstly, you can see the Period Start date for which the entries relate to. Then the Period Name which is based on the View By option chosen (for example, where View By is 'Day', the Period Name would be 'Monday', 'Tuesday' etc, whereas if 'Month' was used, the Period Name would show as 'May', 'June' etc).

Most of the remaining information in the Lines FastTab are flowfields which can be clicked into to show the entries within the "Posted Quality Orders" page that make up the value. The No of Posted Quality Orders will display the qty of Posted Quality Orders within that period. The Qty Tested (Base) will display the sum of the Qty. Tested per "Posted Quality Order" within that period.

The Qty. Passed (Base) will show the Qty. Passed for all of the "Posted Quality Orders" within the specified period. You can also see the statistics for the amounts failed for the period within the Qty. Failed (Base) column. The Pass (%) data cannot be drilled into but will display the value as a percent that have passed for the Items for the period. Finally, the Qty. Reworked (Base) and Qty. Scrapped (Base) will show the qtys that have either been posted as reworked or scrapped on the "Posted Quality Orders".
At the bottom of the page, a Chart Fasttab is available which will display the statistics by period in chart form based on a Qty. Passed vs Qty. Failed overview. Clicking Refresh will update the page to ensure the data it uses is live and the Previous and Next buttons allow you to move the chart to see previous/future months figures.

Vendor/Customer (By Item) Quality Statistics looks a little different. Here you can view the individual Items and their own statistics. You can also use the filters to Hide Items with no Quality Orders, which may help to reduce the quantity of items you can see here. Start Date and End Date filters can also be applied to limit what period you want to view the data for. The Location Filter may be helpful if you only want to check the results Location at a time.
The purpose of these reports are to give you visibility for the Customer, Vendor, Item or SKU and it's overall performance in relation to posted quality orders and can be really helpful as a reporting tool to see how things could be improved.